Informatec strengthens its Data & AI expertise with Databricks With the Databricks Lakehouse Platform, Informatec unifies modern data engineering, BI, and AI capabilities to help companies accelerate innovation and create measurable business value.
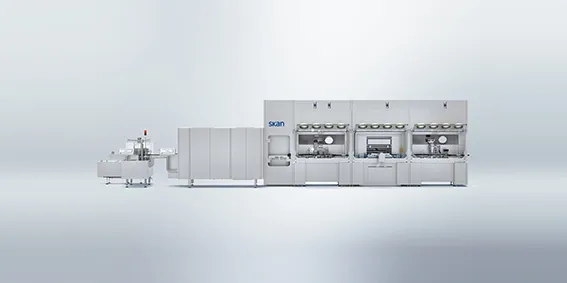
Success Story SKAN AG With Informatec, SKAN AG stabilized its Power BI environment, modernized its ETL architecture, and established a future-proof, standardized BI organization.